Dashboard Overview
Your central hub for monitoring business performance across all merchants. Track total volume, applications, transactions, and sales trends at a glance.
Overview
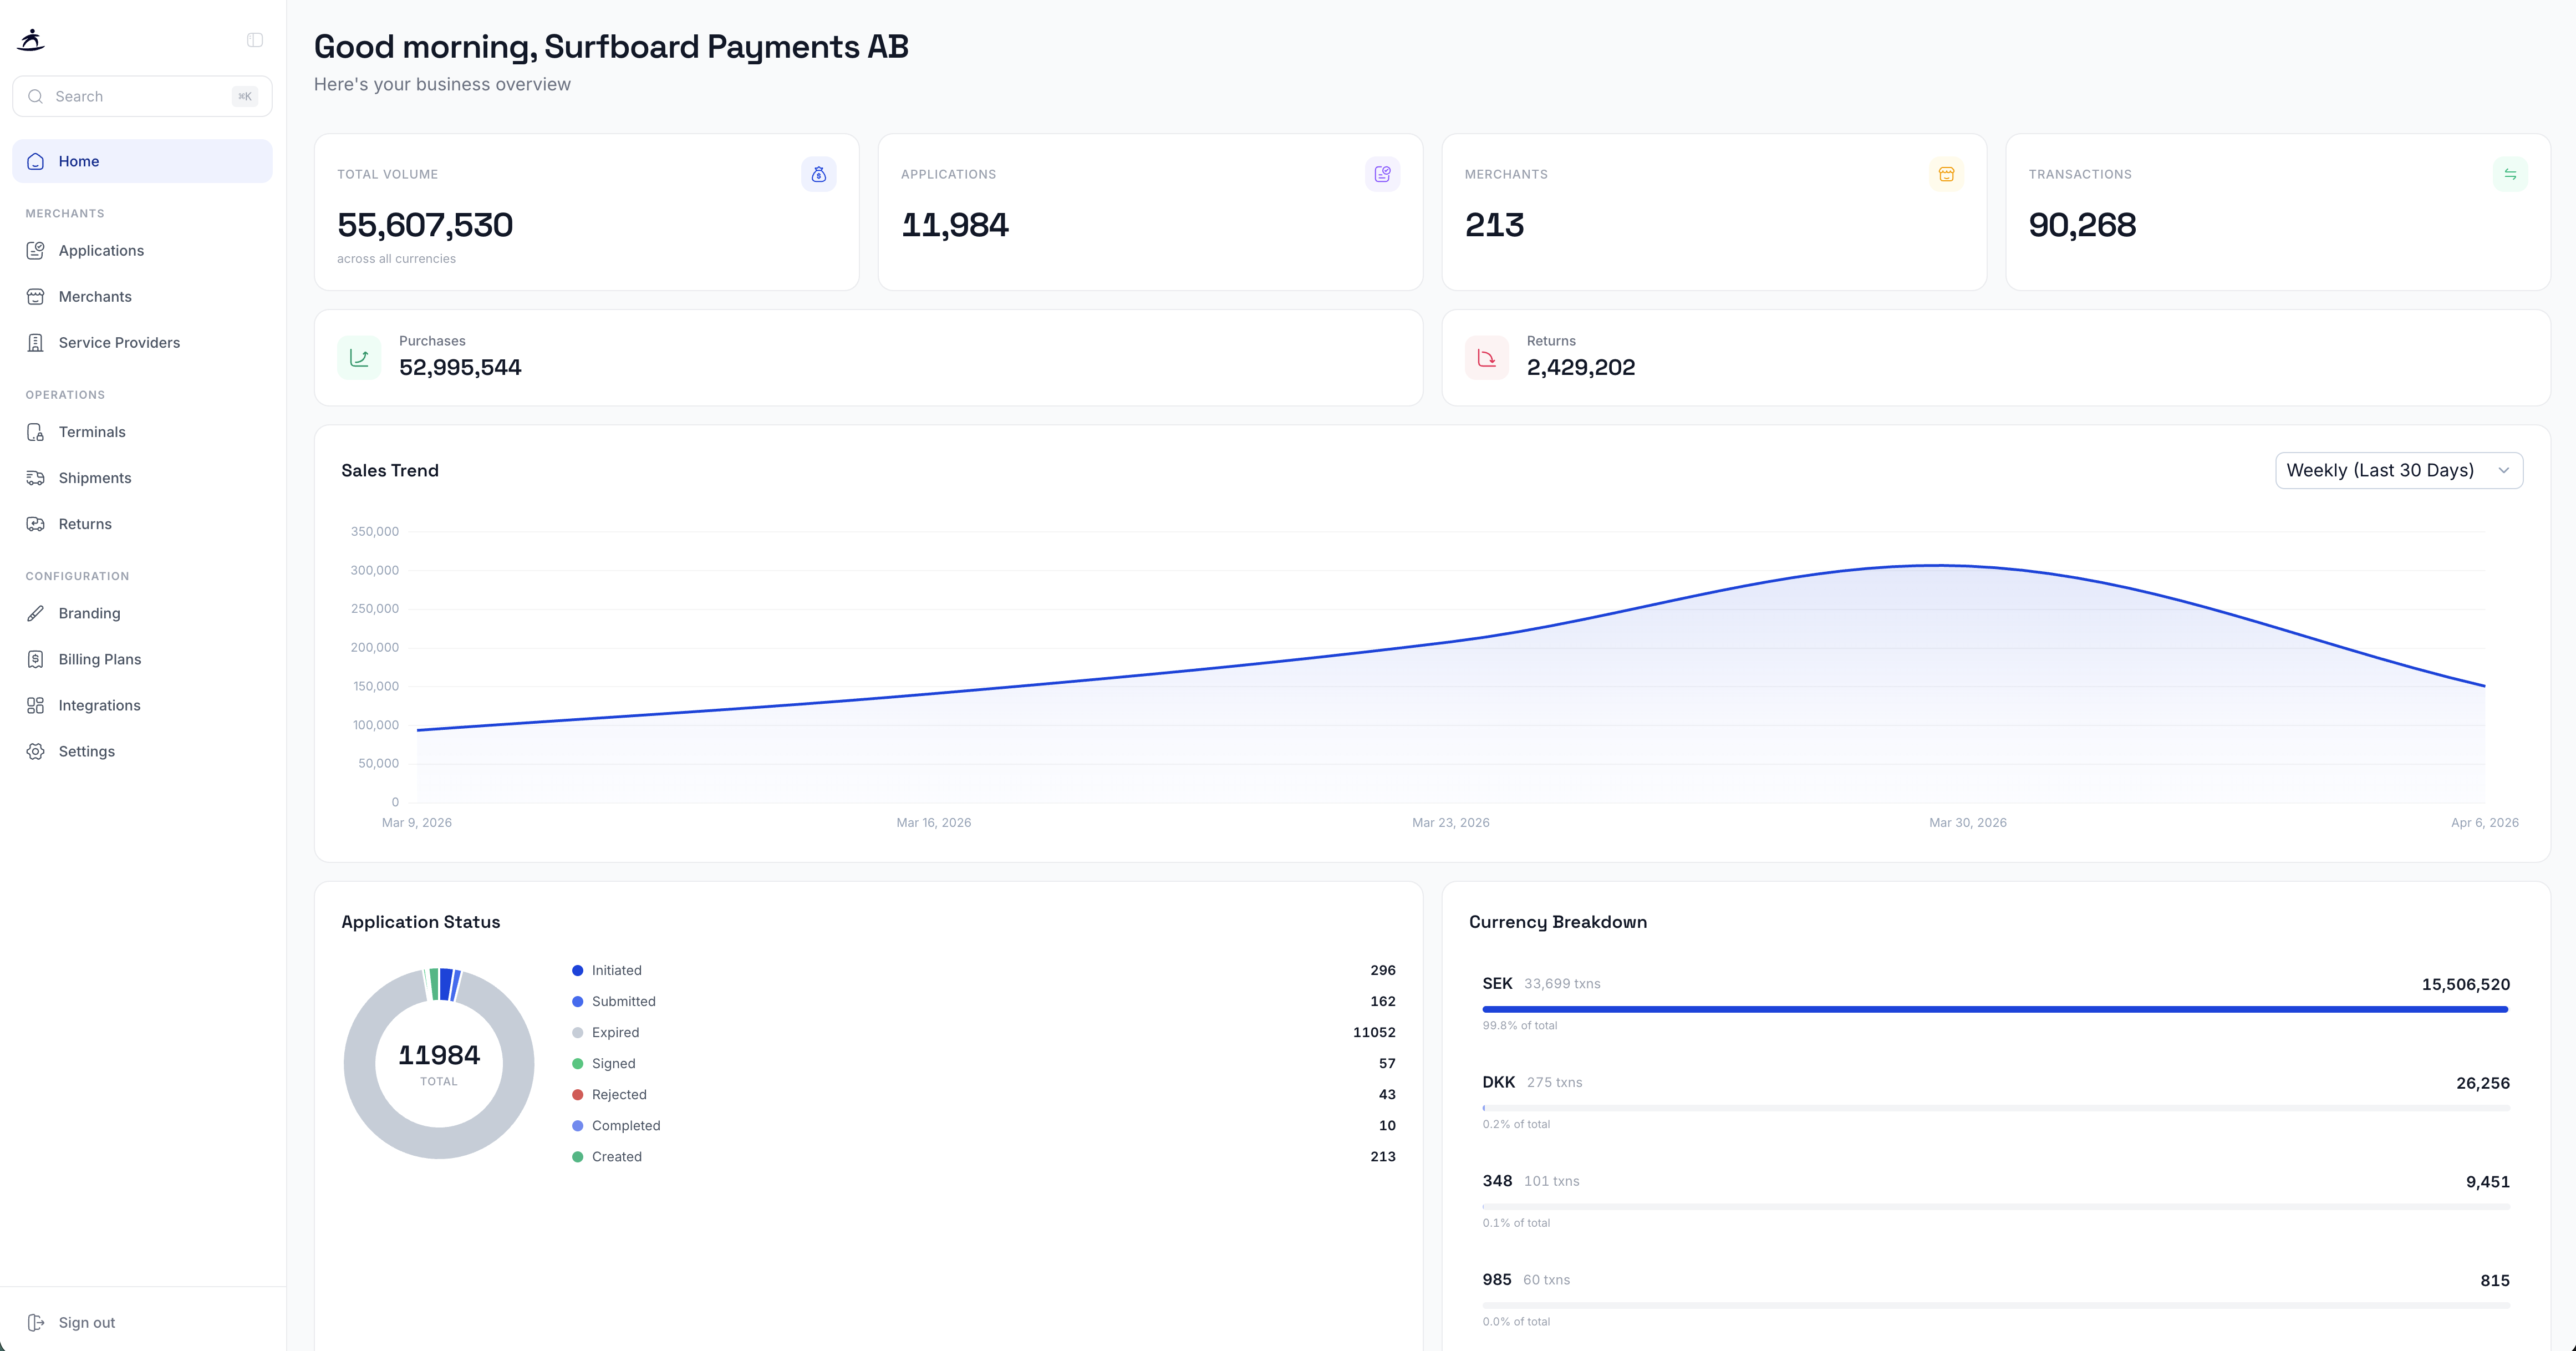
The Partner Portal dashboard is the first thing you see after logging in. It provides a real-time snapshot of your entire payment operation, giving you instant visibility into your merchant portfolio’s performance.
Logging In
Access the Partner Portal at partner.surfboardpayments.com. Your account has a defined role that determines what you can do in the portal — your primary job is to onboard merchants and manage their terminal distribution.
Once authenticated, you land on the dashboard, with the left-side navigation giving you access to all core partner functions: Applications, Merchants, Devices, Shipments, Returns, Branding, Billing Plans, Integrations, Settings, Tickets, and Messages.
Tip: Open Support → Messages early and subscribe a shared email address. That is where Surfboard publishes settlement, integration, and service notices, and nothing is emailed until an address is added. See Messages.
The Partner Lifecycle
As a Surfboard partner, your core responsibility is to onboard merchants and ensure their payment terminals are operational. The lifecycle follows a clear sequence:
- Login — access the Partner Portal.
- Application — create a new merchant application; the system generates an Application ID and a signing link. See Applications & Merchant Onboarding.
- Signing — the merchant signs the application, creating their Merchant ID.
- Terminal Distribution — ship or assign terminals to the merchant. See Shipments & Returns.
- Activation — activate the terminal(s) against the merchant. See Terminal Management.
- Registration — register the device so it’s live and processing-ready.
- Post-Setup — configure apps, payments, branding, and reports.
- Tickets — raise support tickets for any queries along the way.
Key Metrics
At the top of the dashboard, four summary cards give you an instant overview:
| Metric | Description |
|---|---|
| Total Volume | Combined sales volume across all currencies and merchants |
| Applications | Number of merchant onboarding applications |
| Merchants | Total active merchants in your portfolio |
| Transactions | Total transaction count across all merchants |
Below the summary cards, two additional cards show:
- Purchases — total purchase transaction count
- Returns — total return/refund transaction count
Sales Trend
The Sales Trend chart visualizes your payment volume over time. Use the dropdown to switch between time intervals:
- Weekly (Last 30 Days) — default view, shows weekly aggregated volumes
- Monthly — longer-term trend across months
- Daily — granular day-by-day breakdown
The chart helps you identify growth patterns, seasonal trends, and any unexpected dips in transaction volume.
Application Status
The Application Status donut chart shows the distribution of your merchant onboarding applications by status:
- Created — applications that have been initiated
- Submitted — applications sent for review/KYB
- Expired — applications that were not completed within the required timeframe
This helps you monitor your onboarding pipeline and follow up on pending applications.
Currency Breakdown
The Currency Breakdown section shows how your transaction volume is distributed across different currencies. This is particularly useful for partners operating across multiple countries.
Navigation
The sidebar provides quick access to all portal sections:
Merchants
- Applications — manage merchant onboarding
- Merchants — browse and manage merchant accounts
- Service Providers — manage service provider relationships
Operations
- Terminals — look up terminal information
- Shipments — manage hardware shipments
- Returns — handle device returns
Configuration
- Branding — customize your brand appearance
- Billing Plans — manage pricing plans
- Integrations — manage software applications
- Settings — account and notification settings
Global Search
Use the search bar at the top of the sidebar to quickly find merchants, applications, or terminals by name, ID, or email. The search works across your entire portfolio.